IADR Abstract Archives
Incisor-lip changes after retraction in skeletal type I/II bimaxillary protrusion
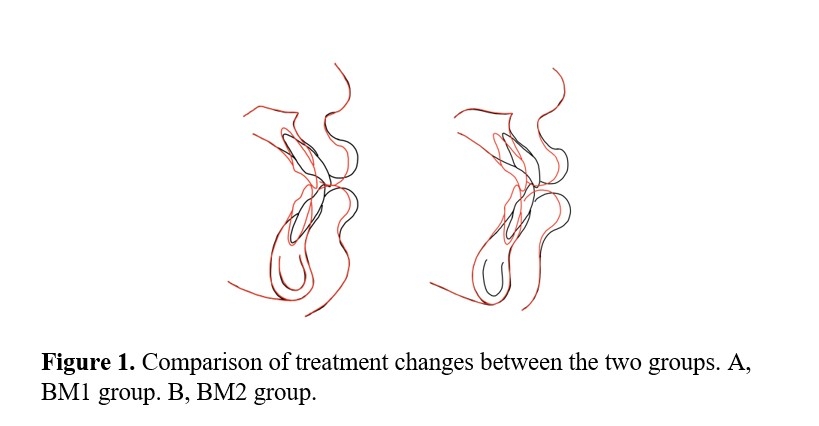
Objectives: To identify the changes of incisors and lips after the retraction in skeletal type I (BM1) and II (BM2) bimaxillary protrusion patients and compare between groups.
Methods: 30 adult bimaxillary protrusion patients (15 in BM1 and 15 in BM2) with four premolars extracted followed by anterior retraction were investigated. Pretreatment (T0) and posttreatment (T1) cephalograms were traced and digitized. Paired and independent t-tests were performed for statistical comparisons within and between groups at p<0.05.
Results: For the incisor change, the changes of upper and lower incisor inclination were significantly different between BM1 and BM2 (p<0.001). The inclination reduction of upper and lower incisors in BM1 were -9.14±2.09 and -9.87±3.85, and -4.80±1.97 and -12.67±1.99 in BM2, respectively. However, there were no statistically significant differences in amount of upper and lower incisor retraction between groups (p=0.212 and p=0.087 respectively). For the change of lips, the lower lip retraction and lip-chin-throat angle (LCTA) reduction in BM2 was greater than BM1 significantly (p<0.001). The changes of lower lip and LCTA were -2.89±0.82 mm and -11.96±6.06 in BM1, and -3.63±0.55 mm and -17.04±5.91 in BM2, respectively. Nevertheless, there were no significant differences in upper lip change and nasolabial angle (NLA) between BM1 and BM2 (p=0.862 and p=0.174 respectively).
Conclusions: The patterns of incisor retraction were different between BM1 and BM2. After treatment, upper incisors were more retroclined in BM1 than BM2, while lower incisors were more retroclined in BM2 than BM1. However, the change of upper lip in both groups were not significantly different, while the lower lip protrusion was reduced more in BM2 when compared to BM1.

