IADR Abstract Archives
Assessment Of Digital Orthopantomograms As A Screening Tool For Osteoporosis
Objectives: The aim of the study was to assess the efficacy of digital panoramic radiographs as a triage screening tool for osteoporotic changes in a large population. It is an attempt to identify the role dentists may play, as part of the medical fraternity, in early detection and and prompt referral of potential cases of osteoporosis for further medical investigations.
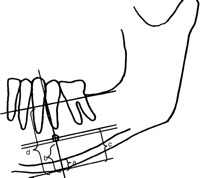
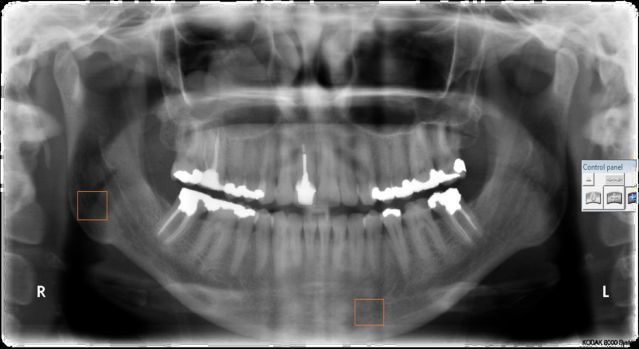
Methods: Evaluation of digital orthopantomograms of 3 groups of female patients that is groups A, B, and C based on their age thats is 20-40 years, 40-60 years and ≧60 years respectively. 3 radiographic indices recorded for each of these films namely the Panoramic mandibular index (PMI), Mandibular cortical width (MCW), and Pixel intensity (PI) using Image J software (1.48v) and assessed for changes in value of each index with increasing age of the patient.A comparison was sought between the two morphometric indices (PMI, MCW) and the Pixel intensity index (PI).
Results: All 3 indices showed a statistically significant association with the age of the patient whereby the abnoraml readings of each was observed to increase with advancing age. A positive correlation was observed between PI and the two morphometric indices (PMI and MCW) as well as between the two morphometric indices themselves. No significant association was however found between the indices and the dentate status of the study sample.
Conclusions: Evaluation of radiographic indices from routinely done digital orthopantomograms can provide useful preliminary information about a patient's risk for developing osteoporosis and be used for triage screening and referral of suspected cases without incurring any additional costs. This study also suggested age to be an important risk parameter for osteoporosis.
IMAGES
2544215_File000000.jpg
2544215_File000001.jpg
2544215_File000000.jpg
2544215_File000001.jpg