IADR Abstract Archives
Characterization of morbidity and mortality from automobile accidents using temporal spatial epidemiological tools in Brazil between 2000 and 2015.
Objectives: Analyze the distribution and temporal-spatial variability of morbidity and mortality due to injuries to the skull and face, taking into account personal characteristics such as gender, age, macroeconomic environment variables, region and type of vehicle.
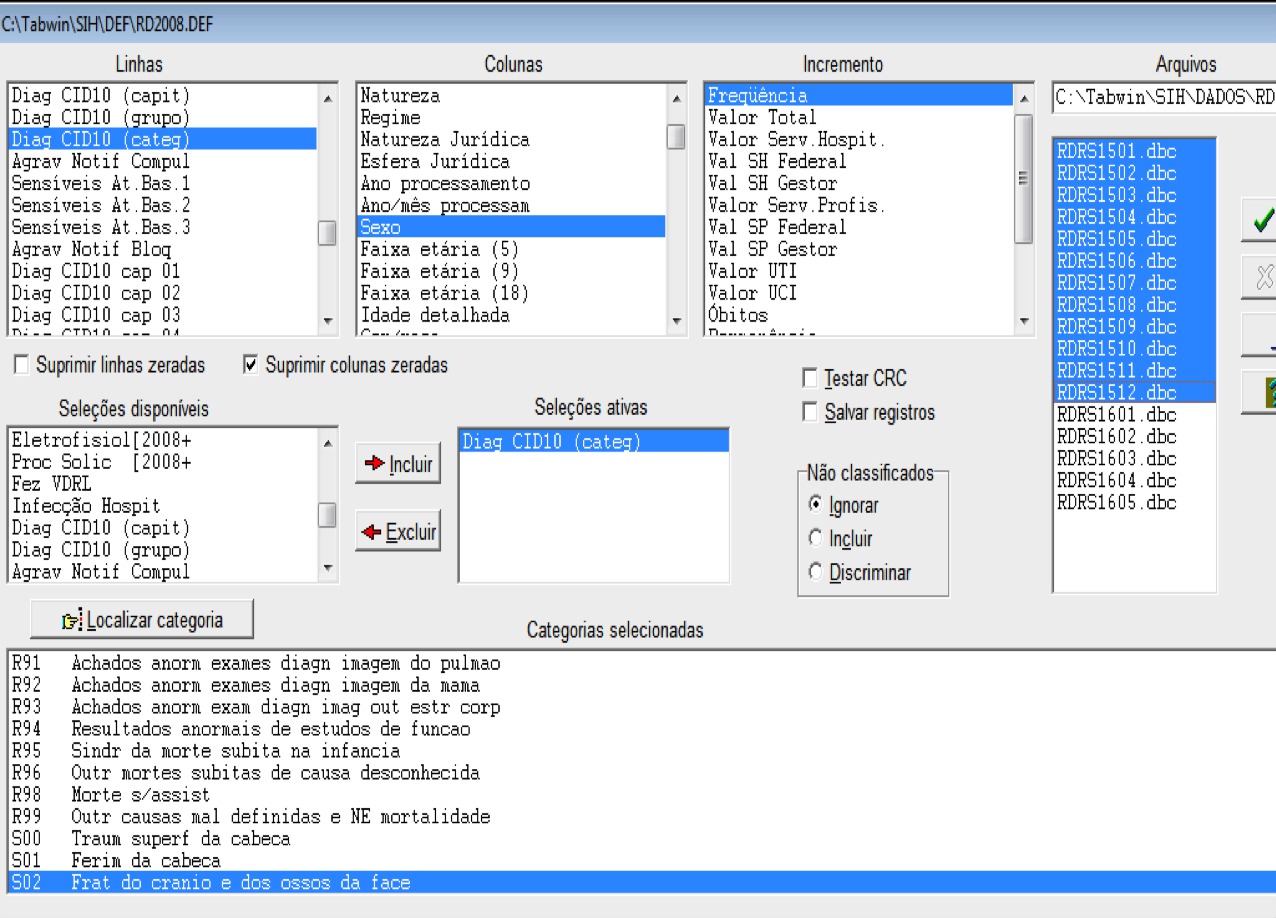
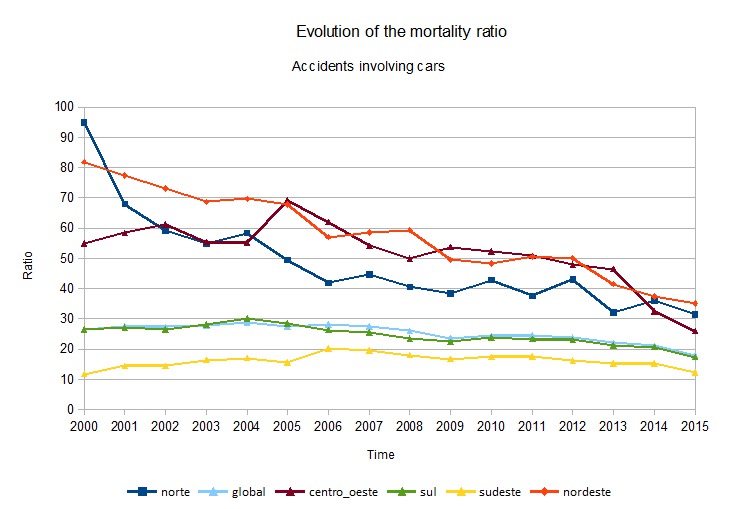
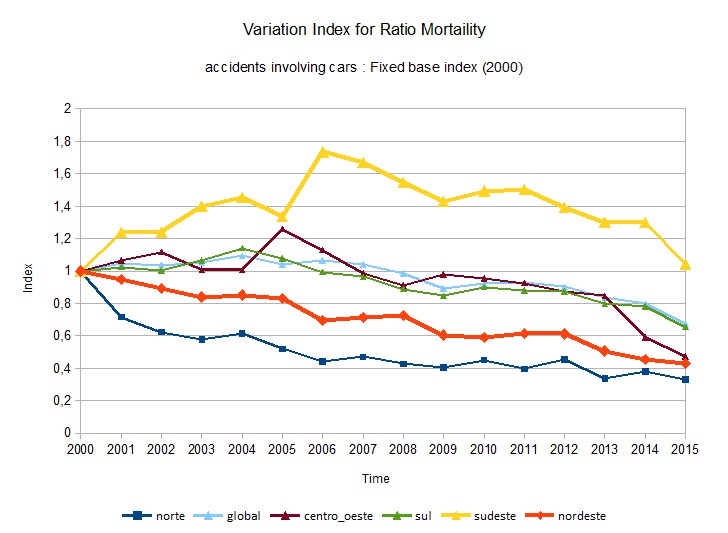
Methods: Secondary data emerged from public archives available on the electronic medium from National Information System were used considering the anatomical sites of trauma, identified by codes S02, S07 and V20 to V40, of ICD 10, chapters XIX and XX. Different units of geo-demographic analysis were defined, responding to a hierarchical structure of 5 regions containing 27 states. The variability in time and space of the data obtained with annual frequency, were evaluated. As a main advance we work with the number of deaths in accidents involving cars and the total population at each of the 5 regions and for the whole country, which gives rise to 6 series of 15 years. A ratio is constructed that compares deceased and exposed and on the other hand an index of temporary evolution with fixed base in year 2000 showing the variation, regardless of the level from which each series begins. This allows to compare reasons that start from very different levels, and associate them with macroeconomic variables such as the Gini and the GDP.
Results: The results show that there were differential behaviors by region both when comparing the reasons that show some downward evolution for the ratios while some fixed base indices show growth during the period, associated with the start-up of the SAMU system.
Conclusions: For these primary results found until now we can say said that there would be 3 groups of regions. On the other hand it is necessary to redefine which states could be taken into account, which will produce a change in the totals of injured and decease, consideringremoving those states that given their geographical location are not exposed in the same way to those that could be considered more urban.
IMAGES
3015843_File000000.jpg
3015843_File000001.jpg
3015843_File000002.jpg
3015843_File000000.jpg
3015843_File000001.jpg
3015843_File000002.jpg