IADR Abstract Archives
Comparing 2 methods of statistical modeling of oral health in a population study in Uruguay
Objectives: In epidemiological studies it is common practice to work with binary variables that reflect the presence of certain diseases, which in turn may be associated with another set of variables, that in general are assumed as risk factors of the former. In epidemiological studies referred to oral health, it is common to inquire about the relationship between the presence of some pathologies and certain characteristics of the study participants through logistic regression.
The objective was to apply and compare 2 methodologies; one applying classical approach of explaining each oral disease separately from a set of explanatory variables and another using a model that allows to consider all oral diseases together for the same explanatory variables, obtaining an individual assessment , interpreted as ``sickness proneness''.
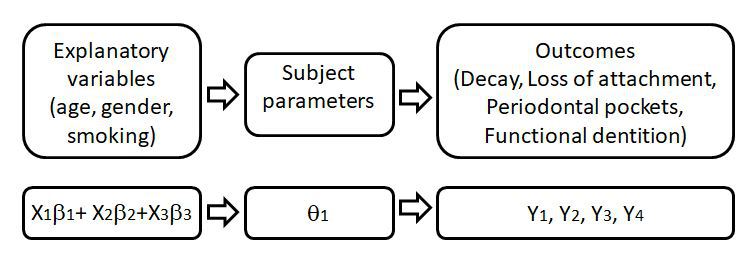
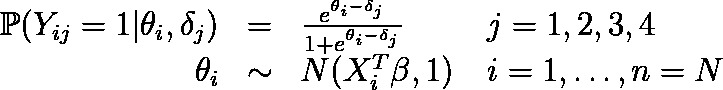
Methods: We propose to use Item Response Theory (IRT) models (specifically Rasch Model) since they allow the joint analysis of a set of variables. The most frequently used IRT models provide indicators that describe the behavior of each variable without considering the possible effect of other set of explanatory variables. To overcome this difficulty we propose to model the outcomes through a Rasch model where the behavior of subject parameters is determined by a normal distribution whose mean is modeled by a linear predictor through Generalized Linear Models (GLM).
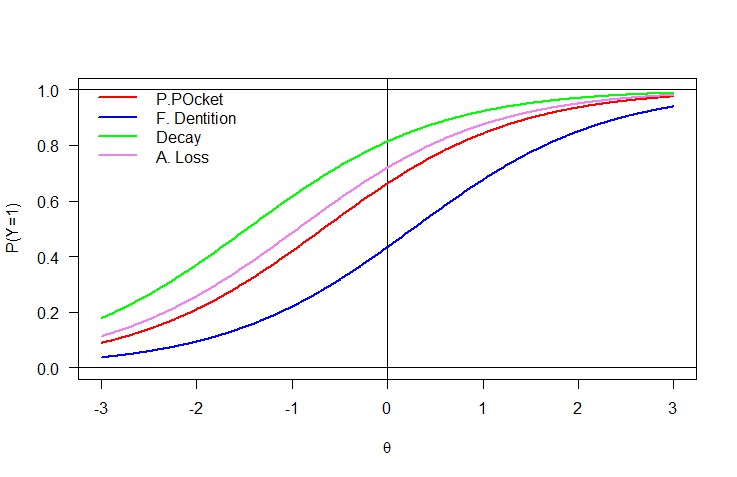
On the other hand, it is applied for each oral disease used as response variable and the same explanatory variables four Logistic Regression models estimated independently.The pathologies are Periodontal Pocket ,Decay ,Functional Dentition,Attachement loss
Results: The data used comes from a study in people demanding attention in assistance service for the High School of Dentistry at Universidad de la República, during the period 2015-2016.
It was observed that smoking does not have a significant effect, nor does sex, while physical activity seems to be an attribute that modulates in some way the prevalence of oral diseases by increasing them.
A non-linear and increasing effect of age on the propensity to suffer oral diseases was observed
Conclusions: Through the different proposed models using IRT aproach it was possible to estimate the prevalence of the pathologies studied jointly as well as the effect of some covariables of interest.
The objective was to apply and compare 2 methodologies; one applying classical approach of explaining each oral disease separately from a set of explanatory variables and another using a model that allows to consider all oral diseases together for the same explanatory variables, obtaining an individual assessment , interpreted as ``sickness proneness''.
Methods: We propose to use Item Response Theory (IRT) models (specifically Rasch Model) since they allow the joint analysis of a set of variables. The most frequently used IRT models provide indicators that describe the behavior of each variable without considering the possible effect of other set of explanatory variables. To overcome this difficulty we propose to model the outcomes through a Rasch model where the behavior of subject parameters is determined by a normal distribution whose mean is modeled by a linear predictor through Generalized Linear Models (GLM).
On the other hand, it is applied for each oral disease used as response variable and the same explanatory variables four Logistic Regression models estimated independently.The pathologies are Periodontal Pocket ,Decay ,Functional Dentition,Attachement loss
Results: The data used comes from a study in people demanding attention in assistance service for the High School of Dentistry at Universidad de la República, during the period 2015-2016.
It was observed that smoking does not have a significant effect, nor does sex, while physical activity seems to be an attribute that modulates in some way the prevalence of oral diseases by increasing them.
A non-linear and increasing effect of age on the propensity to suffer oral diseases was observed
Conclusions: Through the different proposed models using IRT aproach it was possible to estimate the prevalence of the pathologies studied jointly as well as the effect of some covariables of interest.
IMAGES
3006662_File000001.JPG
3006662_File000005.jpg
3006662_File000006.jpg
3006662_File000001.JPG
3006662_File000005.jpg
3006662_File000006.jpg