IADR Abstract Archives
Cigarrete Increases Apical Periodontitis Bone Resorption in Rats
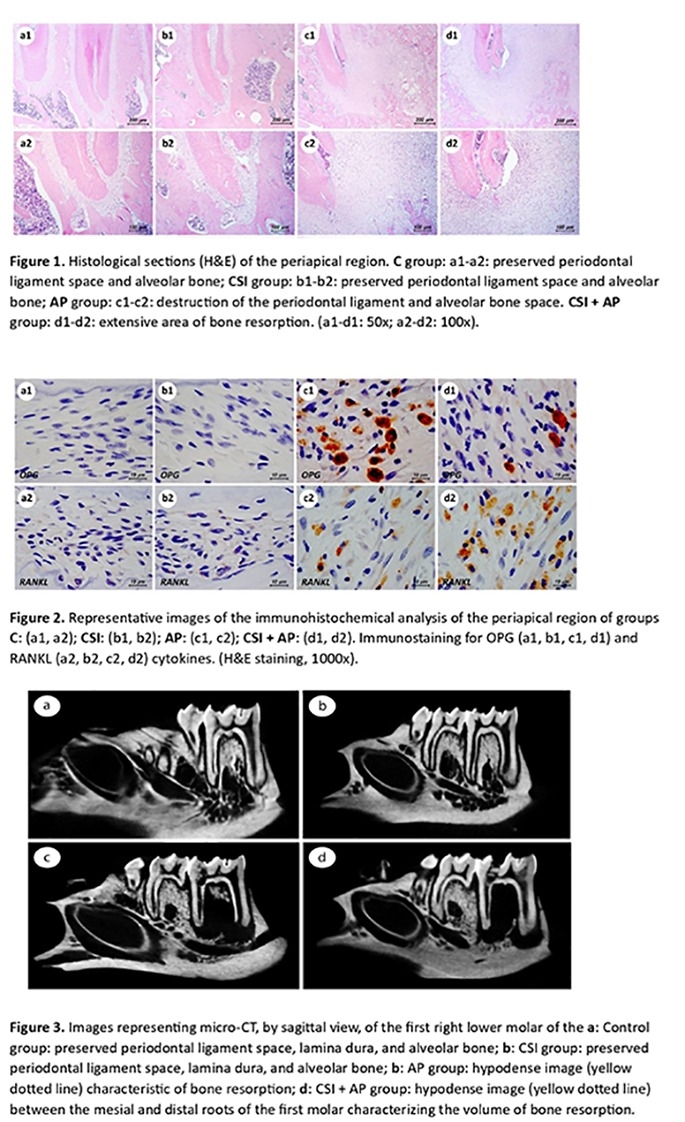
Objectives: Evaluate effects of cigarette smoke inhalation(CSI) associated with apical periodontitis(AP) induced in rats using markers of bone turnover and histometric, immunohistochemical, and microtomographic analysis.
Methods: 32 three-month-old male Wistar rats were divided into four experimental groups (n=8): C-Control; CSI-rats with CSI; AP-rats with AP; and CSI+AP - rats with CSI and AP. The rats of the CSI and CSI+AP groups inhaled cigarette smoke while remaining inside a smoke chamber for 8min, 3times per day, for 50days. After 20days of smoke inhalation, rats of the AP and CSI+AP groups had first right lower molar pulps exposed to the oral cavity for 30 days to induce AP. In these subsequent 30days, CSI and CSI+AP rats groups continued with CSI. On day 50, they were euthanized. Blood was collected to evaluate serum alkaline phosphatase, calcium, phosphorus, nicotine, and cotinine levels, and the mandibles were removed for histological processing to evaluate bone resorption via histometric, immunohistochemical (RANKL/OPG), and microtomographic analysis. The Mann-Whitney test was applied for nonparametric data and Student’s t-test was applied for parametric data, with significance level of P<0.05.
Results: Serum calcium concentration was lower in the CSI + AP group compared to the AP group (P=0.036). Bone resorption occurred in the AP and CSI + AP groups. The histometric analysis showed a larger area of bone resorption for the CSI + AP group (P=0.004) and the microtomographic analysis showed greater volume of resorption (P<0.001) compared to the AP group. The CSI + AP group had a high immunostaining pattern for RANKL compared to the AP group (P<0.001), which had a higher immunostaining pattern for OPG (P=0.015) compared to the CSI + AP group.
Conclusions: AP associated with CSI resulted in a larger area of alveolar bone resorption and higher immunostaining for RANKL, predominating osteoclastic activity.

