IADR Abstract Archives
Head Injuries in Early Childhood: Is There a Social Gradient?
Objectives: Injuries are important causes for children’s morbidity and mortality worldwide. Head injuries are the most prevalent type of injuries during early childhood, and are largely preventable. Evidence regarding the existence of a social gradient is inconclusive.
This study aimed to examine if there is a social gradient in early childhood head injuries among UK children at ages three, five and seven.
Methods: Data came from the UK Millennium Cohort Study, a UK prospective project that follows the lives of approximately 19,000 children.
Logistic regression models were used to examine the association between head injuries and parental social class; household income, maternal education and area deprivation at ages 3, 5 and 7.
The sample size for the analysis for each sweep was: 15,382; 15,042 and 13,682 respectively.
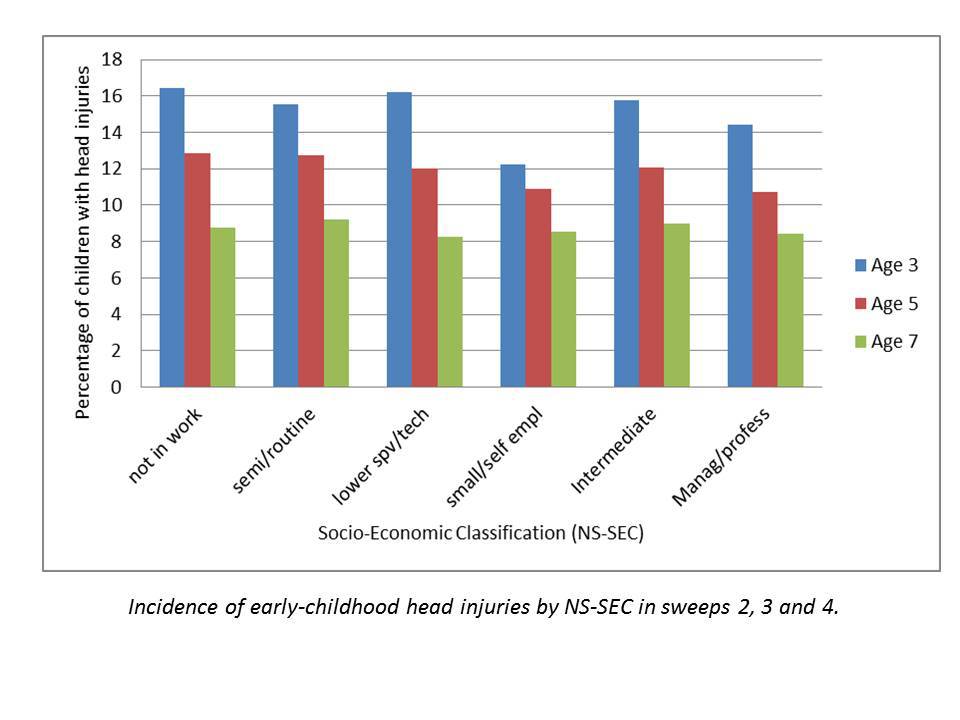
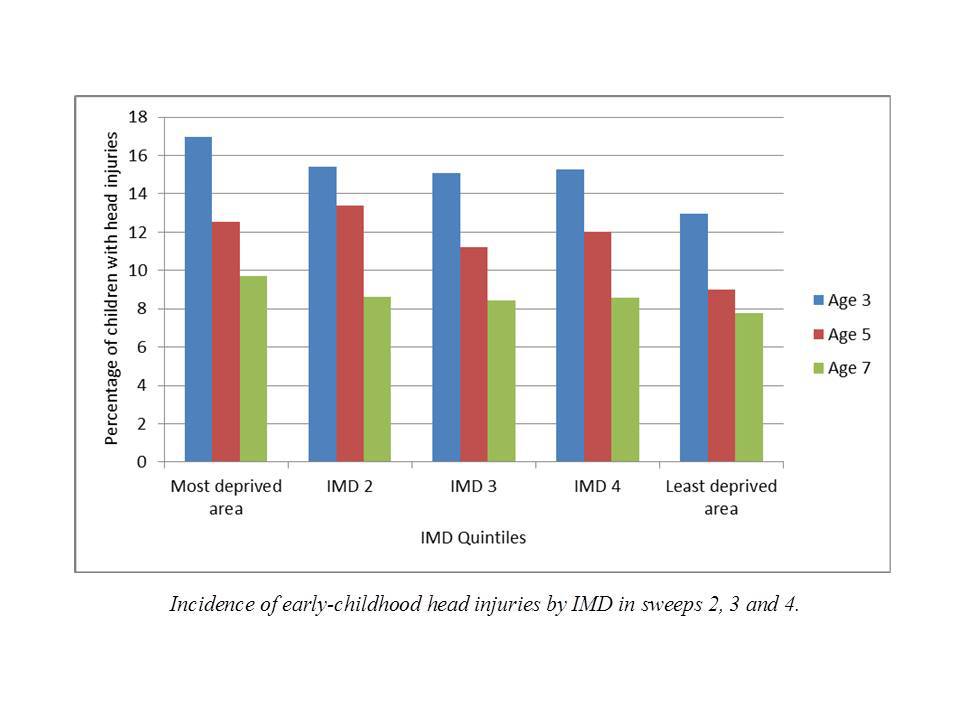
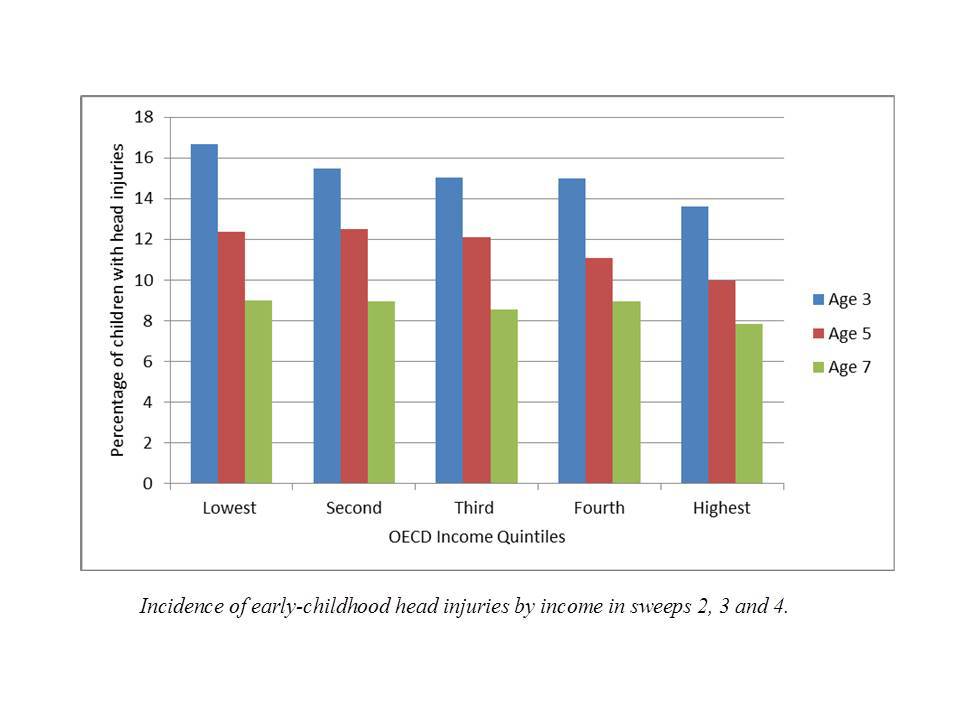
Results: No linear social gradients were observed for any marker of family socioeconomic position. At ages 3 and 5, head injuries were associated with area deprivation, low income and low social class. At age 7, only area deprivation was weakly related to head injuries.
Head injuries were more prevalent among males at all ages. At age 3 and 5 the child’s age was not significant, but at age 7 the association became significant. There was an association between head injuries and the mother’s age at all sweeps.
Conclusions: Prevalence of head injuries in early childhood was not socially graded. There appeared to be threshold effects in that children from the most disadvantaged backgrounds were most likely to experience head injuries, however these associations were weak. Potential limitations in relation to data quality will be discussed.
These findings suggest that in the aetiology of head injuries, environmental factors such as area deprivation have an important effect in early-childhood head injuries prevalence; suggesting a threshold effect. Therefore socio-demographic determinants should be taken into account.
This study aimed to examine if there is a social gradient in early childhood head injuries among UK children at ages three, five and seven.
Methods: Data came from the UK Millennium Cohort Study, a UK prospective project that follows the lives of approximately 19,000 children.
Logistic regression models were used to examine the association between head injuries and parental social class; household income, maternal education and area deprivation at ages 3, 5 and 7.
The sample size for the analysis for each sweep was: 15,382; 15,042 and 13,682 respectively.
Results: No linear social gradients were observed for any marker of family socioeconomic position. At ages 3 and 5, head injuries were associated with area deprivation, low income and low social class. At age 7, only area deprivation was weakly related to head injuries.
Head injuries were more prevalent among males at all ages. At age 3 and 5 the child’s age was not significant, but at age 7 the association became significant. There was an association between head injuries and the mother’s age at all sweeps.
Conclusions: Prevalence of head injuries in early childhood was not socially graded. There appeared to be threshold effects in that children from the most disadvantaged backgrounds were most likely to experience head injuries, however these associations were weak. Potential limitations in relation to data quality will be discussed.
These findings suggest that in the aetiology of head injuries, environmental factors such as area deprivation have an important effect in early-childhood head injuries prevalence; suggesting a threshold effect. Therefore socio-demographic determinants should be taken into account.
IMAGES
2306826_File000000.jpg
2306826_File000002.jpg
2306826_File000001.jpg
2306826_File000000.jpg
2306826_File000002.jpg
2306826_File000001.jpg