IADR Abstract Archives
Direct Colour Printing on 3Y-TZP and 5Y-PSZ Using UV-C Photons
Objectives: To elucidate the feasibility of direct colour printing on 3Y-TZP and 5Y-PSZ using 222nm UV-C photons, and observe whether yttria contents lead to different optical changes.
Methods: 3Y-TZP and 5Y-PSZ in white shade (Upcera, China) were cut, polished and sintered to a final size of 15.50mm diameter × 1.20mm thickness with mirror-like surfaces. 222nm UV-C light was used to irradiate samples for 0 (control), 15, 30 minutes, 1, 4 and 24 hours (irradiance: 1.870mW/cm2). A colourimeter (Nix pro2, Canada) was used to measure CIEL*a*b* values of samples (n=6) before (0th day) and at different time points after irradiation (1st (Immediately after), 2th, 4th, 8th, 11th and 15th days). Colour difference (ΔE*) and translucency parameter (TP) were calculated. Crystalline structure and surface morphology were observed before and immediately after irradiation by XRD and SEM (n=3). SPSS 28.0 was used for statistical analysis (α=0.05).
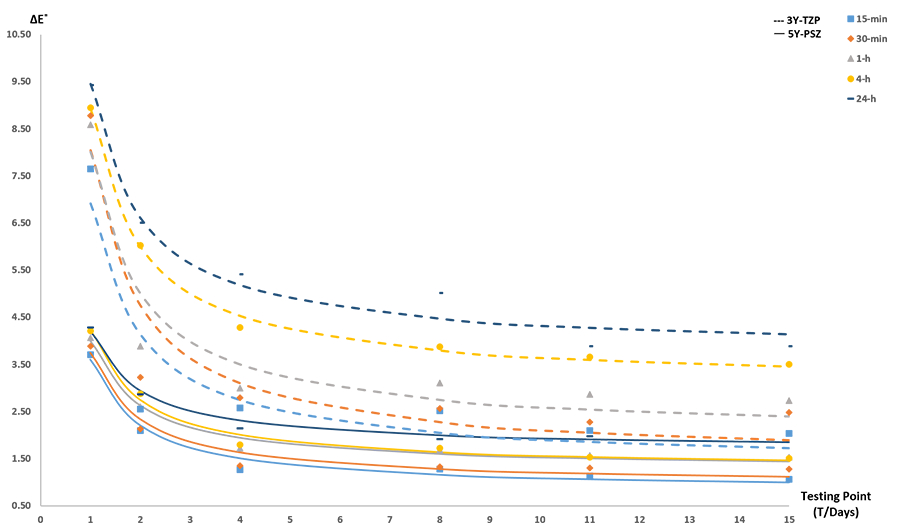
Results: 222nm UV-C successfully printed tooth colours on both 3Y-TZP and 5Y-PSZ. The longer the irradiation time, the higher the ΔE*, while 5Y-PSZ always got lower ΔE* than 3Y-TZP in all irradiation groups at all testing points. Partial colour recovery was observed in all groups, and inversely proportional relationships were confirmed between ΔE* and testing points. At the thickness of 1.20mm, there was no difference between TP of as-sintered 3Y-TZP and 5Y-PSZ. The UV-C irradiation decreased the TP of all groups, and the decrease was more obvious in 3Y-TZP than 5Y-PSZ when the irradiation time was longer than 30 minutes. TP of all groups gradually recovered to baseline level over time with inversely proportional relationships discovered between TP and testing points. Crystalline structure and surface morphology of 3Y-TZP and 5Y-PSZ were different, but were unaffected by UV-C.
Conclusions: By inducing oxygen vacancy (VO2+) and altering band gap, direct colour printing on 3Y-TZP and 5Y-PSZ was achieved by using 222nm UV-C photons. The colour changes were highly predictable by controlling irradiation time. The different reactions of 3Y-TZP and 5Y-PSZ can be attributed to the different contents of yttria, different crystalline structures, and the stability of the induced VO2+. This seminal approach has potential to replace the conventional colouring technique of dental zirconia.
Methods: 3Y-TZP and 5Y-PSZ in white shade (Upcera, China) were cut, polished and sintered to a final size of 15.50mm diameter × 1.20mm thickness with mirror-like surfaces. 222nm UV-C light was used to irradiate samples for 0 (control), 15, 30 minutes, 1, 4 and 24 hours (irradiance: 1.870mW/cm2). A colourimeter (Nix pro2, Canada) was used to measure CIEL*a*b* values of samples (n=6) before (0th day) and at different time points after irradiation (1st (Immediately after), 2th, 4th, 8th, 11th and 15th days). Colour difference (ΔE*) and translucency parameter (TP) were calculated. Crystalline structure and surface morphology were observed before and immediately after irradiation by XRD and SEM (n=3). SPSS 28.0 was used for statistical analysis (α=0.05).
Results: 222nm UV-C successfully printed tooth colours on both 3Y-TZP and 5Y-PSZ. The longer the irradiation time, the higher the ΔE*, while 5Y-PSZ always got lower ΔE* than 3Y-TZP in all irradiation groups at all testing points. Partial colour recovery was observed in all groups, and inversely proportional relationships were confirmed between ΔE* and testing points. At the thickness of 1.20mm, there was no difference between TP of as-sintered 3Y-TZP and 5Y-PSZ. The UV-C irradiation decreased the TP of all groups, and the decrease was more obvious in 3Y-TZP than 5Y-PSZ when the irradiation time was longer than 30 minutes. TP of all groups gradually recovered to baseline level over time with inversely proportional relationships discovered between TP and testing points. Crystalline structure and surface morphology of 3Y-TZP and 5Y-PSZ were different, but were unaffected by UV-C.
Conclusions: By inducing oxygen vacancy (VO2+) and altering band gap, direct colour printing on 3Y-TZP and 5Y-PSZ was achieved by using 222nm UV-C photons. The colour changes were highly predictable by controlling irradiation time. The different reactions of 3Y-TZP and 5Y-PSZ can be attributed to the different contents of yttria, different crystalline structures, and the stability of the induced VO2+. This seminal approach has potential to replace the conventional colouring technique of dental zirconia.
IMAGES
4215848_File000001.jpg
4215848_File000001.jpg