IADR Abstract Archives
Farnsworth-Munsell-100 Hue and Perceptual Ability Tests Predict Dental Shade Matching
Objectives: Determine if Farnsworth-Munsell-100 Hue Test (FM-100), Perceptual-Ability Test (PAT), ethnicity, age, gender, and time predict dental shade matching ability and value discernment in first-year dental students.
Methods: Beneath a Judge II booth (color temperature=6500°K, color rendering index=90), FM-100 was administered to 98 first-year dental students. For Value Test students arranged lightest to darkest three sets of five masked shade tabs from Vita Toothguide 3D Master shade guide (V3DM). In all three sets value ranged from 1-5. Set #1 hue and chroma were constant, set #2 chroma was constant but hues differed, set #3 hues and chroma differed. Students matched together 11 pairs of masked shade tabs from two V3DM guides (Matching Test). Ethnicity, age, PAT scores, gender, and time to complete tests were recorded. Data analyzed using ANOVA, Wilcoxon rank-sum test, and linear regression (p=0.05). Study received expedited approval (VCU IRB #HM20002312).
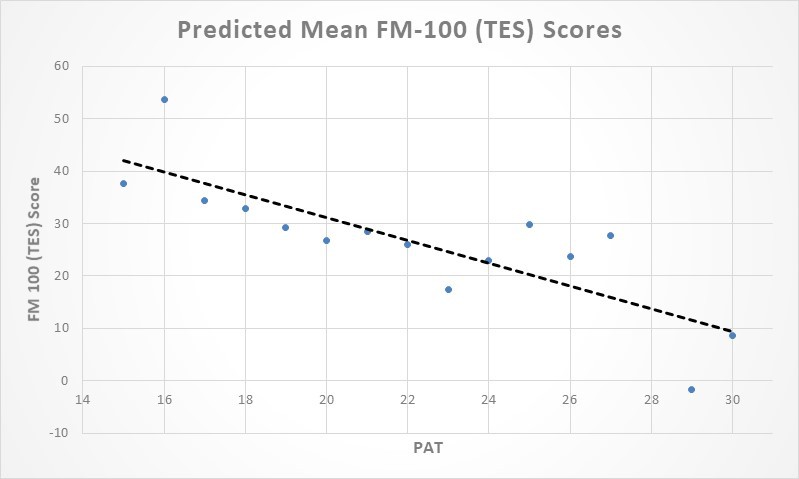
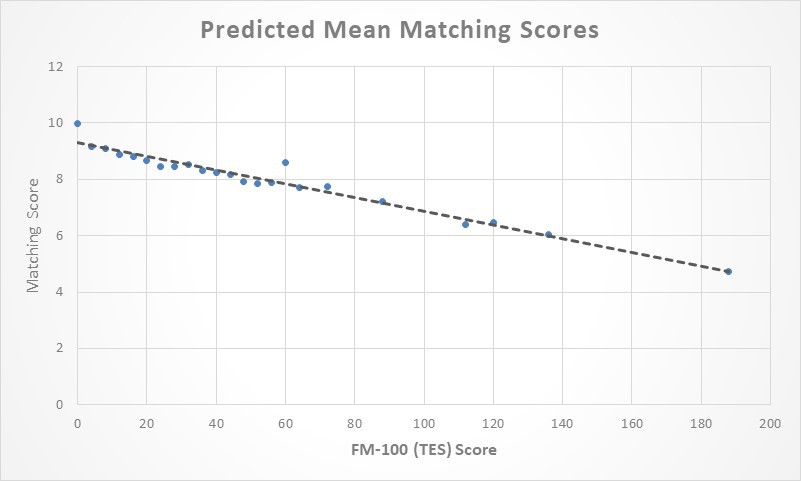
Results: FM-100 total error scores (TES) ranged from 0-188. Forty-three students had superior color discrimination (TES 0-16). Three of the 43 had TES=0. Fifty-one had average (TES 18-100) and 4 poor color discrimination (TES>100). Table 1 illustrates results of the four tests. Table 2 illustrates test results by gender. Ethnicity, age and gender didn't significantly influence any tests (p>0.05). Increased time resulted in better performance on FM-100 (p=0.0017) and Matching test (p=0.032). However, longer time resulted in less correct answers for Value test (p=0.0162). There was a significant correlation between PAT and FM-100 results (p=0.0009). As PAT scores increased, TES scores decreased indicating better color acuity (Image 1). Similarly, lower TES scores resulted in higher Matching Test results (p=0.0002) (Image 2). However, this was not observed for the Value Test (p=0.302).
Conclusions: Students with higher PAT scores exhibited higher color acuity (lower TES) and should be better at dental shade matching.
Methods: Beneath a Judge II booth (color temperature=6500°K, color rendering index=90), FM-100 was administered to 98 first-year dental students. For Value Test students arranged lightest to darkest three sets of five masked shade tabs from Vita Toothguide 3D Master shade guide (V3DM). In all three sets value ranged from 1-5. Set #1 hue and chroma were constant, set #2 chroma was constant but hues differed, set #3 hues and chroma differed. Students matched together 11 pairs of masked shade tabs from two V3DM guides (Matching Test). Ethnicity, age, PAT scores, gender, and time to complete tests were recorded. Data analyzed using ANOVA, Wilcoxon rank-sum test, and linear regression (p=0.05). Study received expedited approval (VCU IRB #HM20002312).
Results: FM-100 total error scores (TES) ranged from 0-188. Forty-three students had superior color discrimination (TES 0-16). Three of the 43 had TES=0. Fifty-one had average (TES 18-100) and 4 poor color discrimination (TES>100). Table 1 illustrates results of the four tests. Table 2 illustrates test results by gender. Ethnicity, age and gender didn't significantly influence any tests (p>0.05). Increased time resulted in better performance on FM-100 (p=0.0017) and Matching test (p=0.032). However, longer time resulted in less correct answers for Value test (p=0.0162). There was a significant correlation between PAT and FM-100 results (p=0.0009). As PAT scores increased, TES scores decreased indicating better color acuity (Image 1). Similarly, lower TES scores resulted in higher Matching Test results (p=0.0002) (Image 2). However, this was not observed for the Value Test (p=0.302).
Conclusions: Students with higher PAT scores exhibited higher color acuity (lower TES) and should be better at dental shade matching.
2814793_File000003.jpg
2814793_File000005.jpg