IADR Abstract Archives
Tooth loss and untreated caries predict food intake limitations
Objectives: Examine association between untreated dental caries and tooth retention and limitations in food intake.
Methods: We used data for 6,885 adults aged 25 years or older from the 1999-2000 and 2001-2002 cycles of the National Health and Nutrition Examination Survey (NHANES). The dependent variable was whether a person reported limiting the kinds and amount of food eaten because of problems with his/her teeth or dentures (i.e., reported frequency of limited food intake (LF) was “sometimes to always” versus “seldom or never”). Explanatory variables of primary interest were dentate status – having most teeth (5 or fewer missing teeth (MT)), having few teeth (6 - 27 MT), or no teeth – and number of teeth with untreated decay (DT) – no DT, DT=1 or DT>1. Our logistic regression model also included potential covariates – age, race/ethnicity, education, gender, family income relative to federal poverty level and self-reported general health. We obtained adjusted odds ratios and prevalence of LF from our regression. All reported findings are significant at p<=0.05.
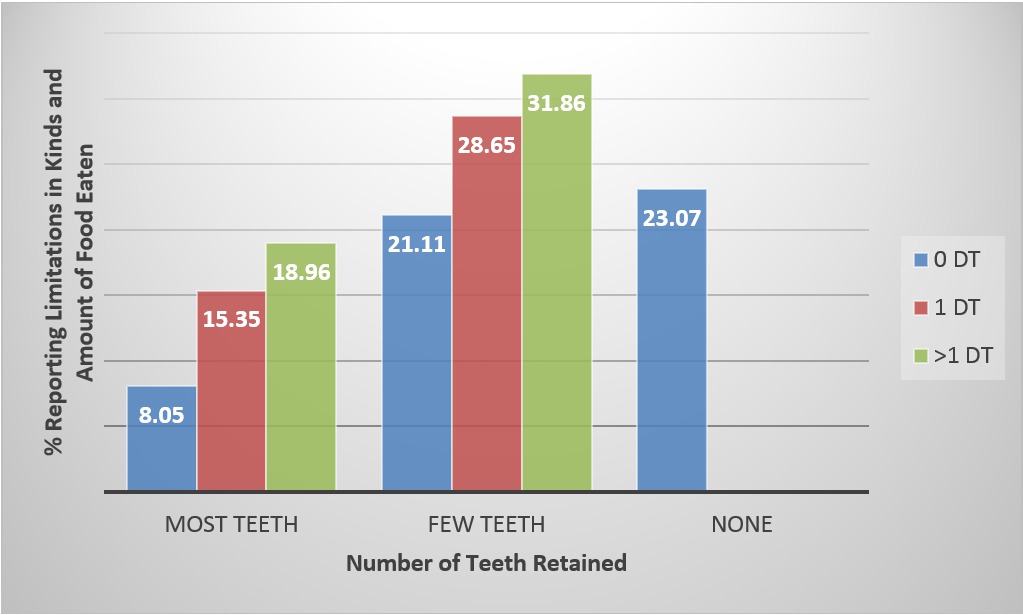
Results: About 60% of adults had most of their teeth and no untreated decay (Table 1); among these persons the adjusted prevalence of LF was 8% (Figure 1). LF prevalence was about 11 percentage points higher for adults with DT>1 vs. DT=0 whether they retained few or most of their teeth (Figure 1 and Table 2). LF prevalence was about 13 percentage points higher among adults with few teeth vs. most whether DT = 0, 1, or >1. LF prevalence did not differ between those with either no teeth or few teeth with no DT. Other predictors of reporting LF included being female, of other race/ethnicity, reporting fair or poor general health and low family income (Table 3).
Conclusions: Having few teeth and/or tooth decay limit people’s food intake, which may affect their quality of life.
Methods: We used data for 6,885 adults aged 25 years or older from the 1999-2000 and 2001-2002 cycles of the National Health and Nutrition Examination Survey (NHANES). The dependent variable was whether a person reported limiting the kinds and amount of food eaten because of problems with his/her teeth or dentures (i.e., reported frequency of limited food intake (LF) was “sometimes to always” versus “seldom or never”). Explanatory variables of primary interest were dentate status – having most teeth (5 or fewer missing teeth (MT)), having few teeth (6 - 27 MT), or no teeth – and number of teeth with untreated decay (DT) – no DT, DT=1 or DT>1. Our logistic regression model also included potential covariates – age, race/ethnicity, education, gender, family income relative to federal poverty level and self-reported general health. We obtained adjusted odds ratios and prevalence of LF from our regression. All reported findings are significant at p<=0.05.
Results: About 60% of adults had most of their teeth and no untreated decay (Table 1); among these persons the adjusted prevalence of LF was 8% (Figure 1). LF prevalence was about 11 percentage points higher for adults with DT>1 vs. DT=0 whether they retained few or most of their teeth (Figure 1 and Table 2). LF prevalence was about 13 percentage points higher among adults with few teeth vs. most whether DT = 0, 1, or >1. LF prevalence did not differ between those with either no teeth or few teeth with no DT. Other predictors of reporting LF included being female, of other race/ethnicity, reporting fair or poor general health and low family income (Table 3).
Conclusions: Having few teeth and/or tooth decay limit people’s food intake, which may affect their quality of life.
IMAGES
2411452_File000000.jpg
2411452_File000000.jpg