IADR Abstract Archives
Protein Expressions in Human Saliva Following Water and Juice Interventions.
Objectives: To assess changes in the salivary protein composition, after short-term exposure (1 minute) and prolonged exposure (10 minutes) to water and apple juice.
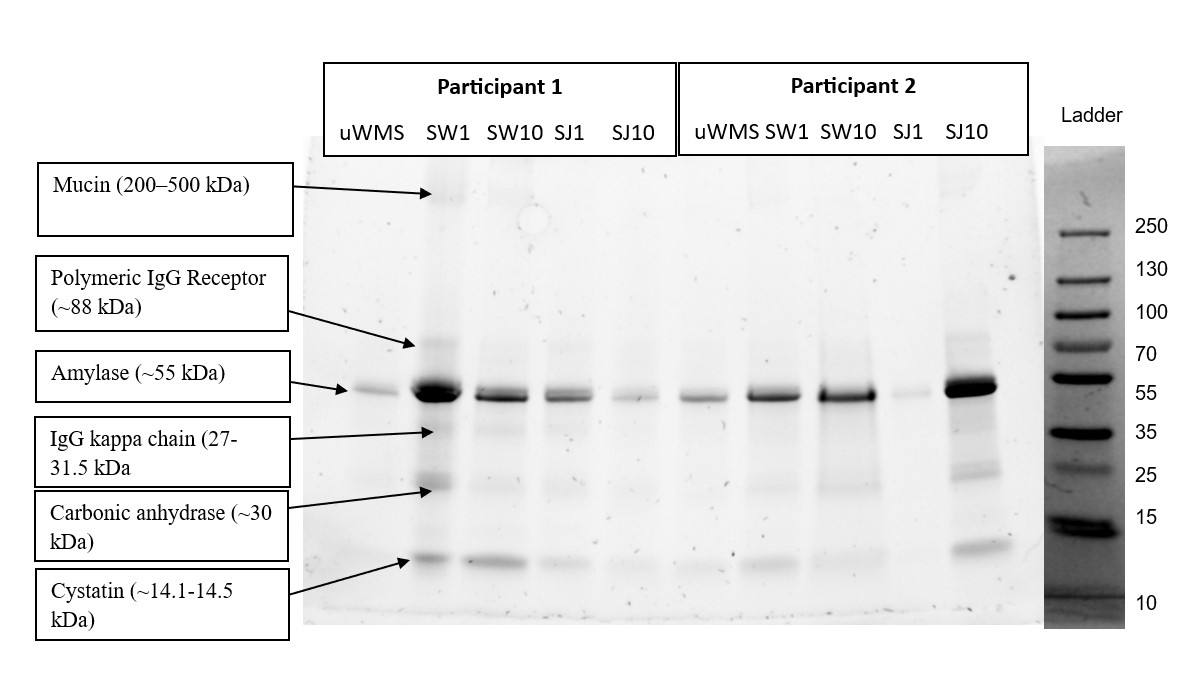
Methods: Saliva samples from 20 participants were collected under five distinct conditions: unstimulated whole mouth saliva (uWMS), saliva after 1 minute of water and juice rinse (SW1, SJ1 respectively), and saliva after 10 minutes of water and juice rinse (SW10, SJ10 respectively). The total protein concentration in each sample was measured using a BCA protein assay (Thermofisher Scientific, IL, USA), allowing for protein equalisation across samples for SDS-PAGE analysis.Samples were diluted, treated with Laemmli buffer, and heated to denature proteins. Electrophoresis was performed on 4-20% TGX stain-free gels, with molecular weights of bands determined against a protein ladder. Protein expression was quantified using densitometry (ImageJ software), normalising data to uWMS. Normalised densitometry values (%) for each protein were pooled from all separate gel analyses (n≤20 participants, Table 1). Due to the non-normal distribution of protein expression data, the Mann-Whitney U test was used to compare two independent groups.
Results: Figure 1 shows protein expression in the 5 saliva groups. A significant decrease (p<0.05) in carbonic anhydrase levels was observed after 1 minute of juice rinse. A significant decrease (p<0.05) in cystatin levels was observed after 10 minutes of juice. Another intriguing finding in our study was the observed significant decrease (p<0.05) in the expression levels of protein bands corresponding to immunoglobulin (Ig) chains, Polymeric IgG receptor and IgG kappa chain following juice intake.
Conclusions: The different expressions in salivary protein levels may have clinical significance and may play a vital role in the buffering of dietary acids and the protection of enamel from erosion.
IMAGES
4287932_File000001.jpg
4287932_File000001.jpg