IADR Abstract Archives
Effect of Sterilization on the Accuracy of 3D-Printed Surgical Guides
Objectives: To evaluate the accuracy of 3D-printed surgical guides before and after sterilization in a steam sterilizer
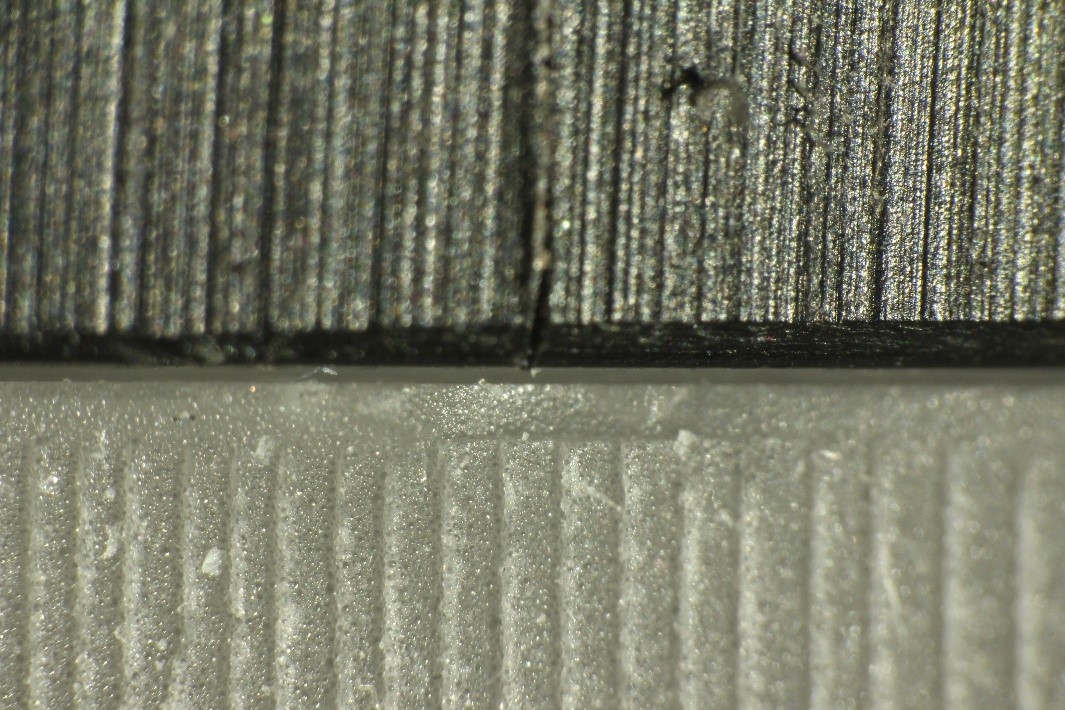
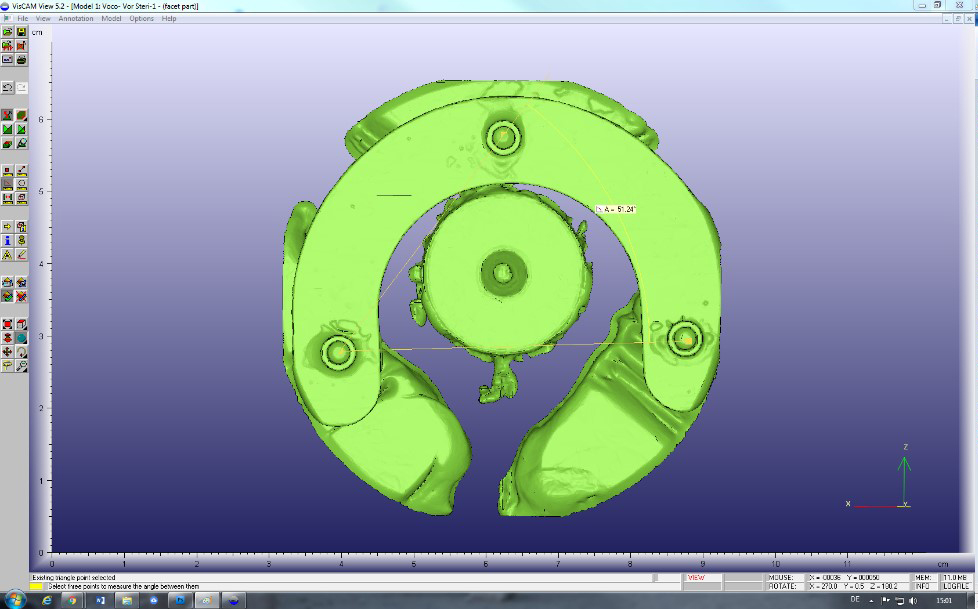
Methods: A test model incorporating three implant-replicas was customized. Forty surgical guides were printed from five printable materials with eight guides each (Gr.1: Sheraprint-SG; Shera, Gr.2: NextDent SG; NextDent, Gr.3: V-Print SG; Voco, Gr.4: Optiprint guide 385; Dentona and Gr.5: LuxaPrint Ortho; DMG). An additional control group was made from self-curing composite-material (Gr.6: Luxatemp Fluorescence; DMG). Specimens were individually-tried on, relined and adapted for passive fit. Resulting spaces between the model and specimens were measured at standardized marked points at a load of 500 g (p1). Specimens were connected to 3 external implant replicas, scanned and the 3 resulting angles were digitally measured. All specimens were sterilized in a steam sterilizer at 121 degrees for 20 min at 2 bar. Resulting spaces (P2) and angulations were remeasured. Additionally, specimens were positioned again with an increased load up to 1800 g and space-measurements were repeated (P3).
Results: All specimens were repositionable after sterilization. The smallest variation in space after sterilization at 500 g load was measured for Gr.3 with a median value of 428 µm, whereas the greatest was for Gr.5 at 1487 µm. Gr.2, 3 and 4 underwent significantly lesser deformation. With applying increased force up to a maximum of 1800 g, the smallest measured change was for Gr.4 with a median value of 94 µm, while the greatest was for Gr.1 at 260 µm. The variation in the three measured angles was not significant before and after sterilization with a maximum median variation of 1.6 degrees.
Conclusions: The results show that the accuracy of surgical guides was affected by the used material as well as by the sterilization process but it was still clinically acceptable when increased load was applied while positioning. However, all surgical guides were repositionable after sterilization.


