IADR Abstract Archives
Effects of Coloring Procedures on Zirconium/Resin Cement Bond Strength
Objectives: Debonding is the common failure seen in restorations with a zirconium core. In the present study, the shear bond strengths between resin cement and colored zirconium oxide core materials were evaluated.
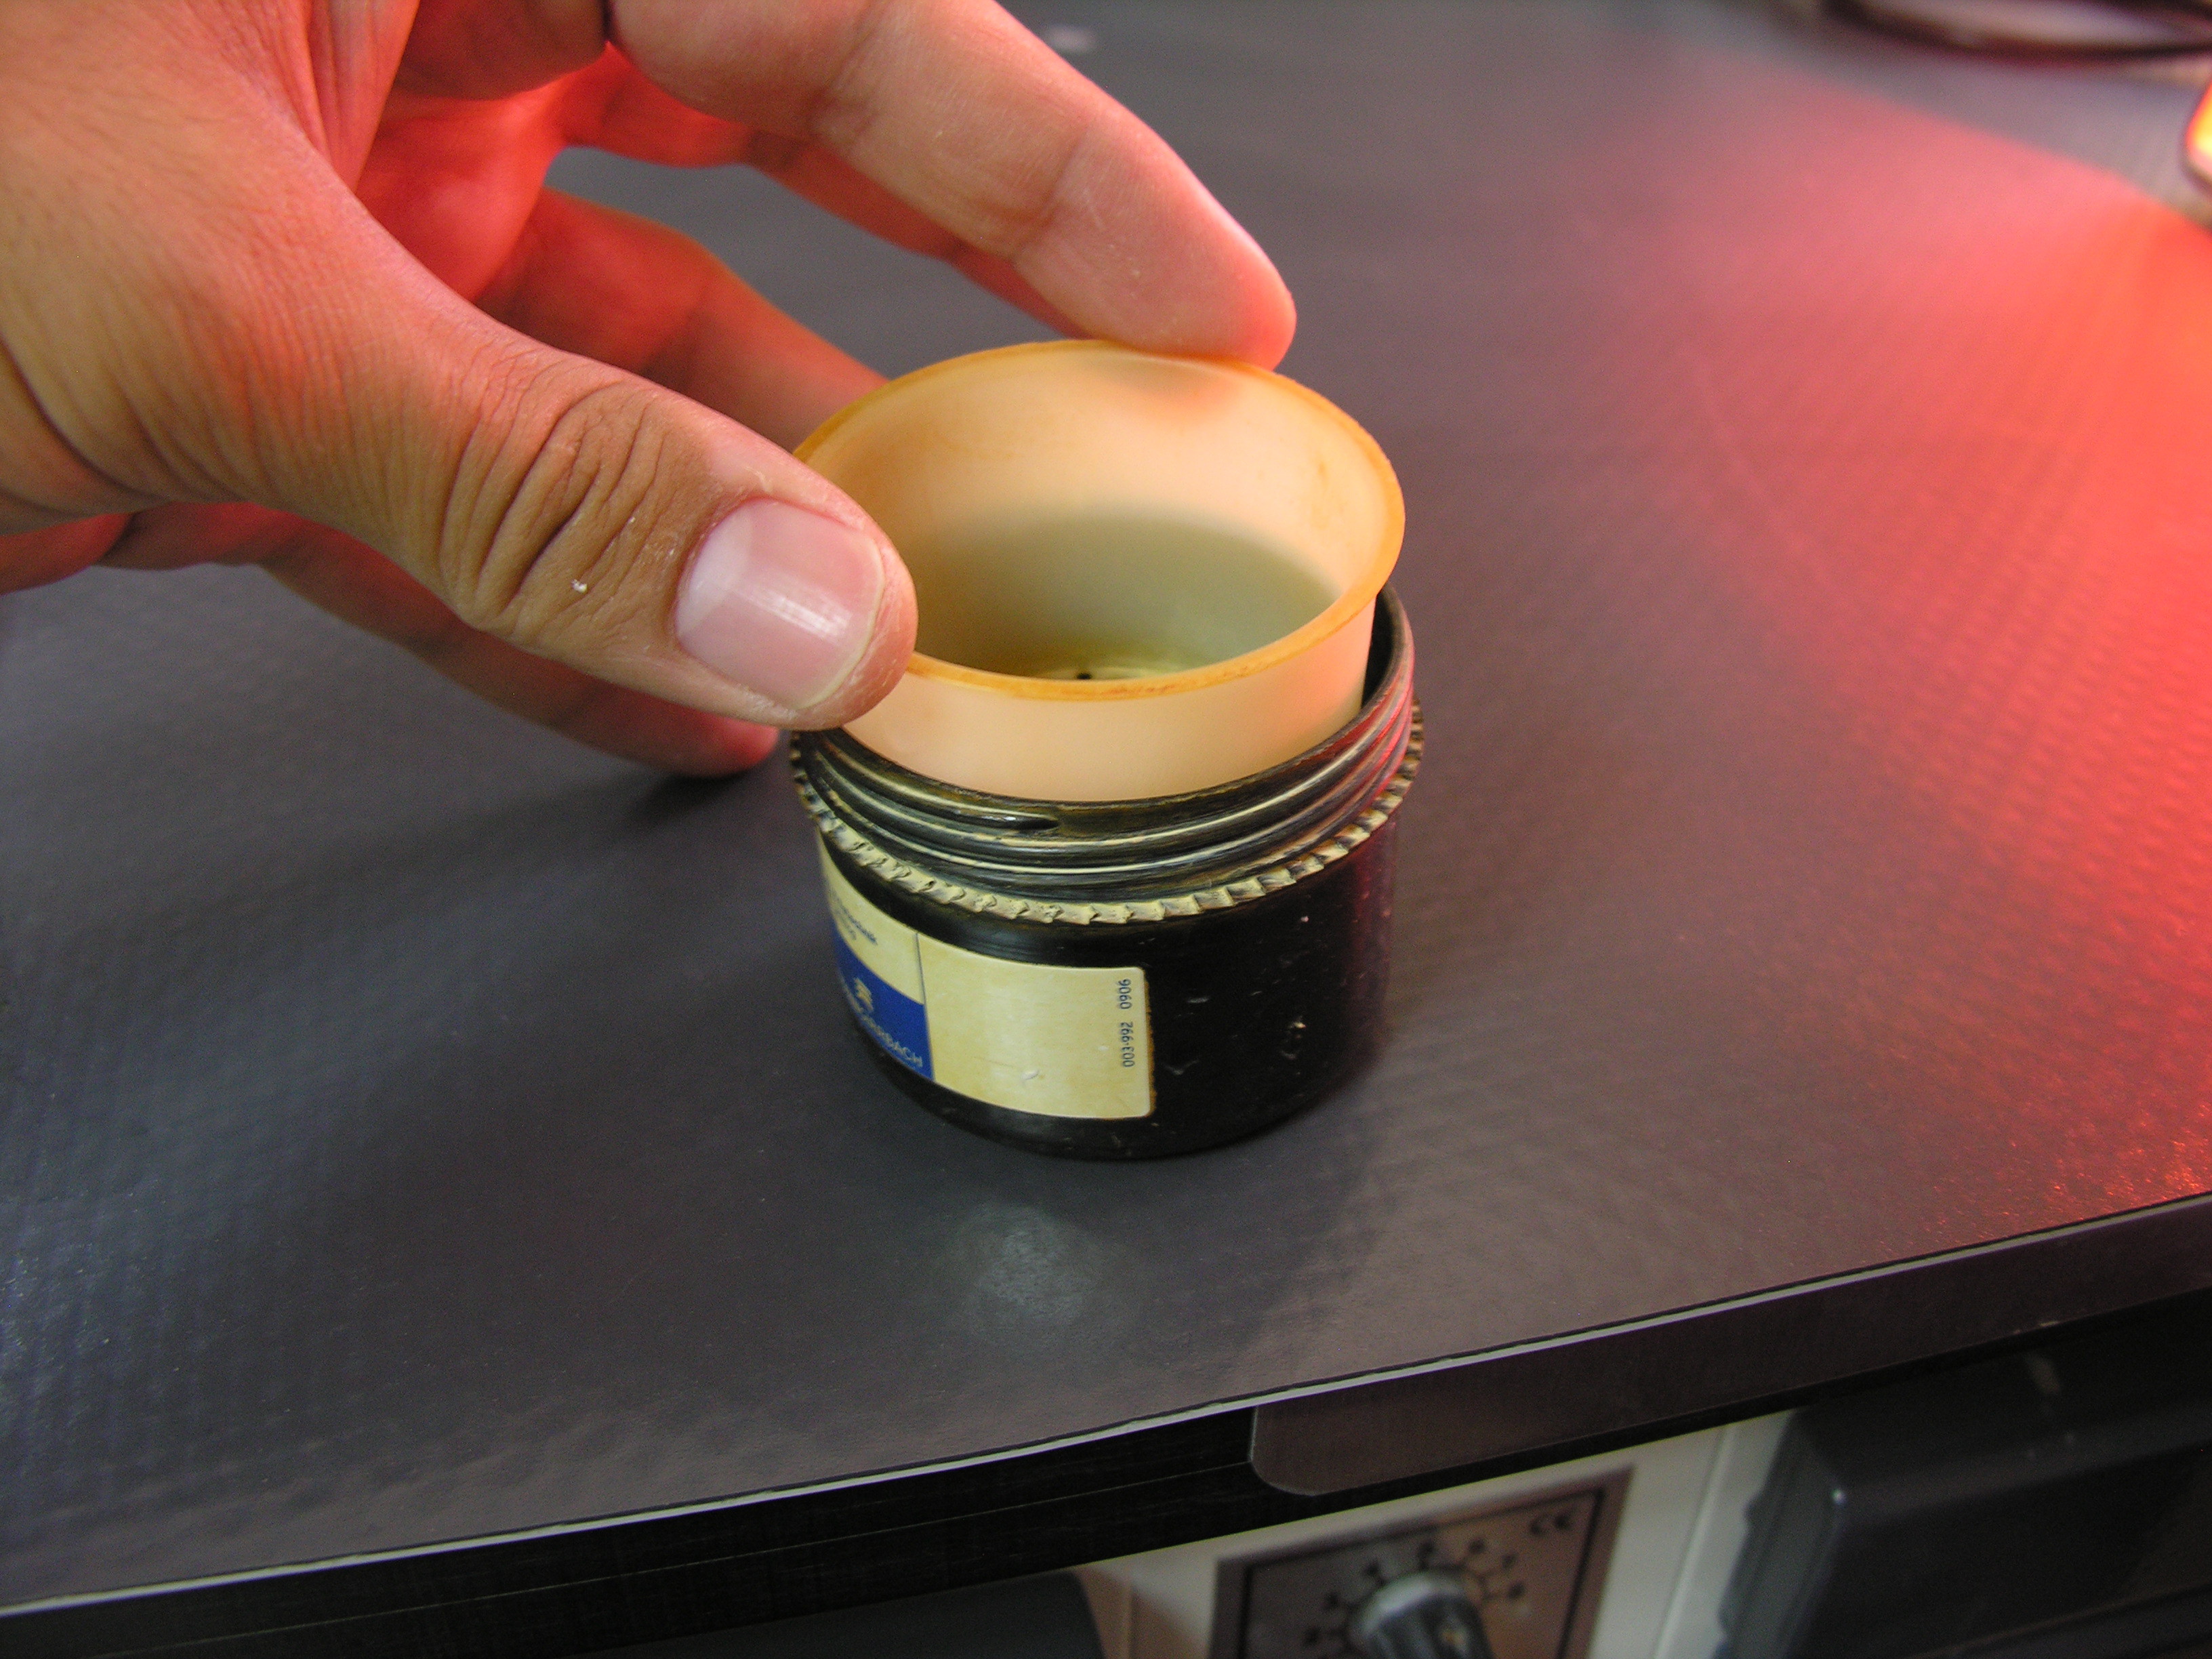
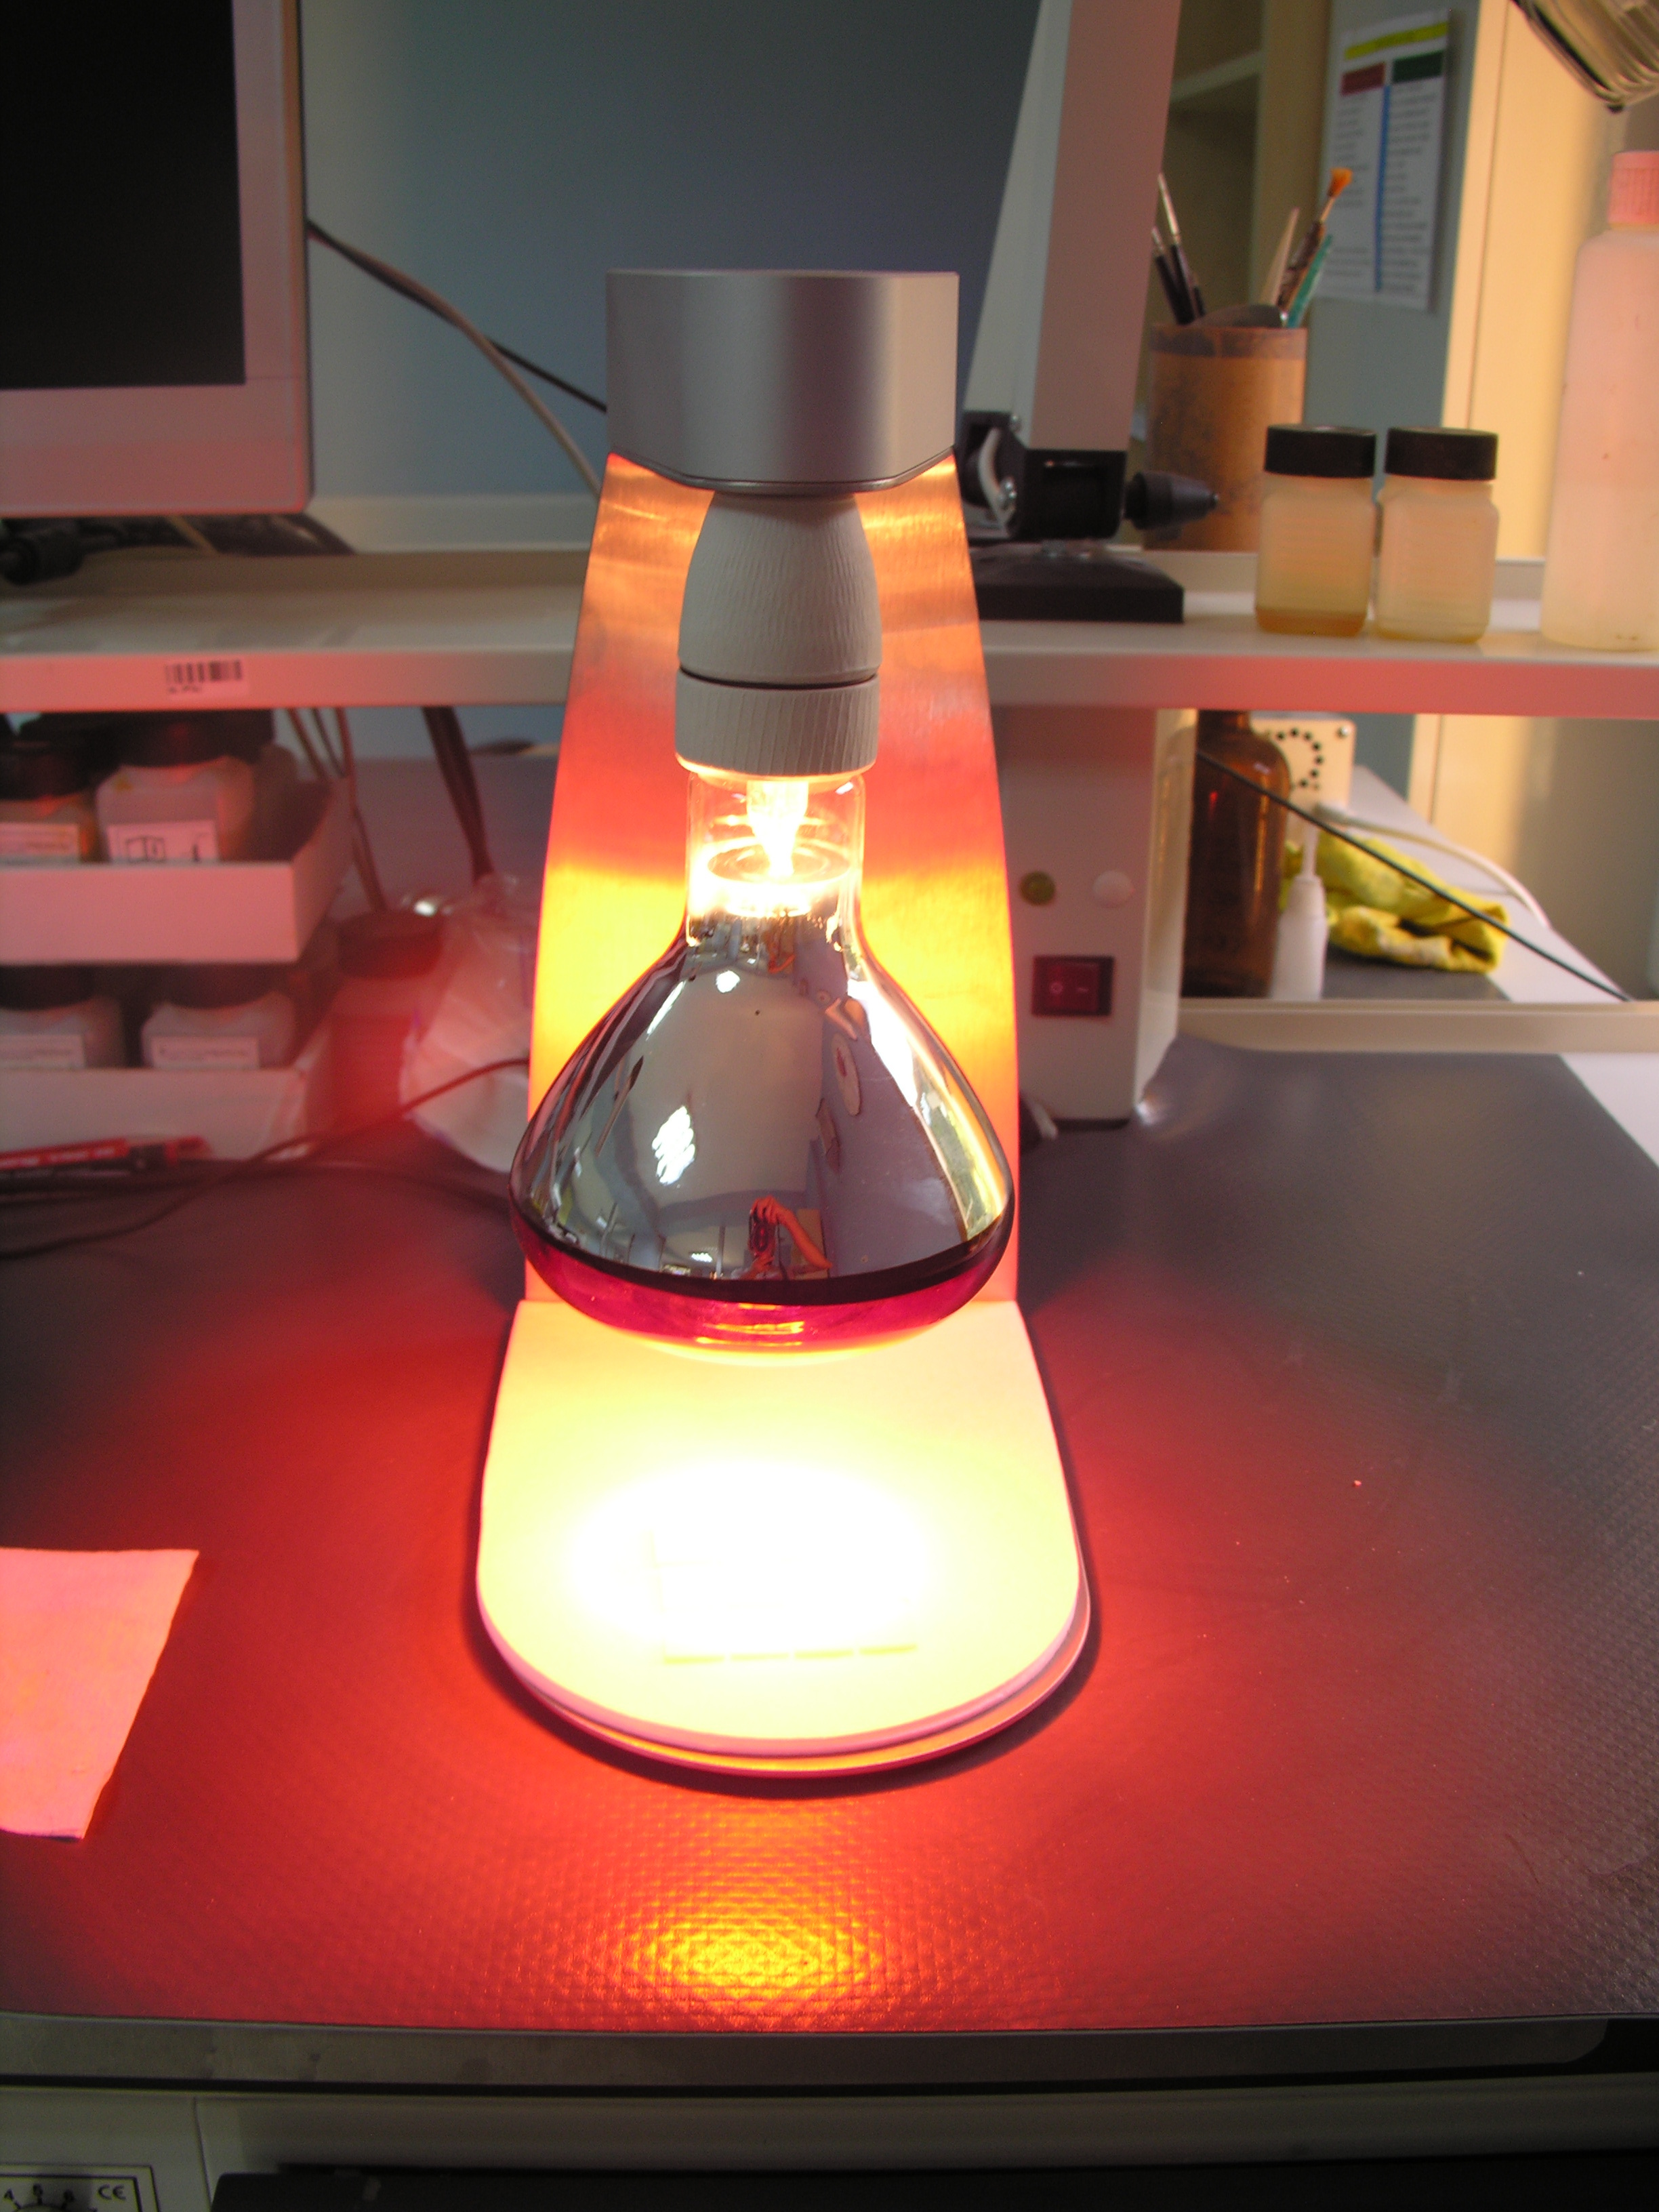
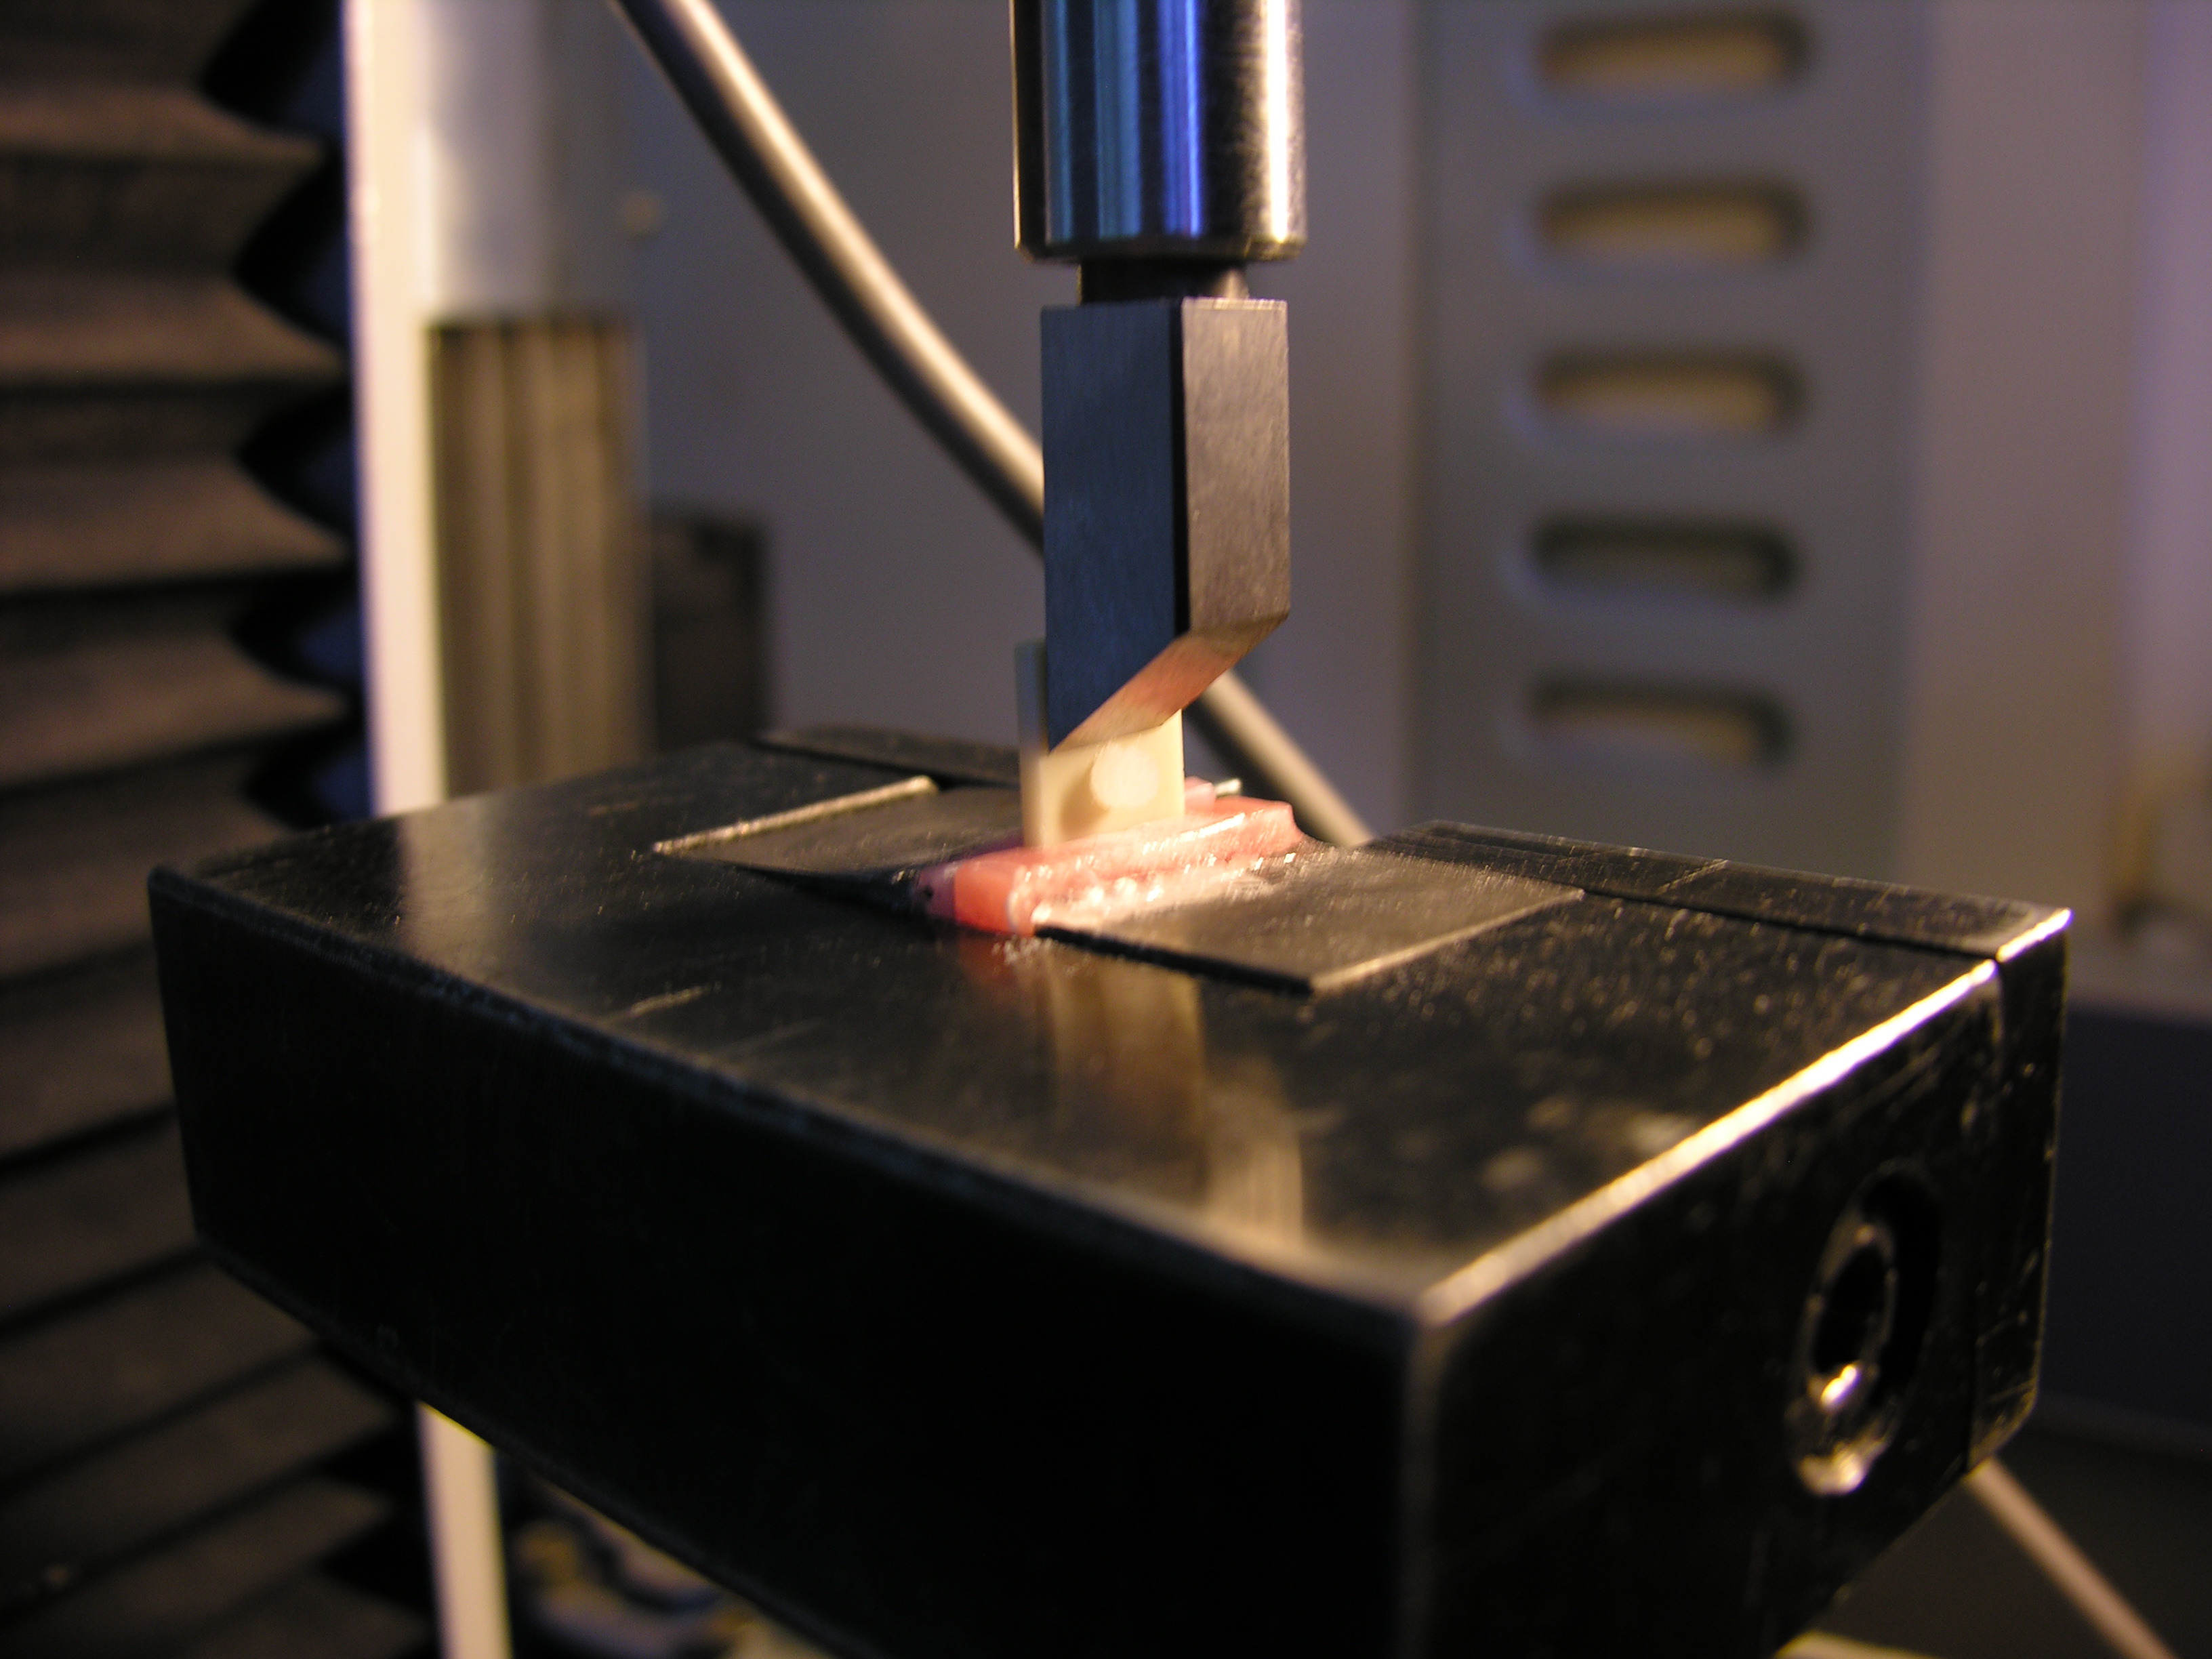
Methods: Zirconium discs (15x12x1.6mm) were divided into 11 groups of 12 discs each. Groups were colored according to the Vita Classic scale: A3, B1, C4, D2, and D4. Each group was treated with the recommended shading time for 3 s, or with prolonged shading for 60 s, except for the control group. Samples were bounded with 3-mm-thick and 3 mm in diameter translucent resin cement and subjected to shear test in a universal testing machine with a crosshead speed of 1 mm/min. One-way analysis of variance (ANOVA) and Tukey's HSD tests were used for comparisons of the groups having the same shading times. A paired t test was used for groups of the same color (3 s/60 s).
Results: Among the 11 groups investigated B1 (60 s) had the highest bond strength, with a value of 10.05 MPa, while A3 (60 s) showed the lowest bond strength, at 6.72 MPa. However, these differences were not statistically significant.
Conclusions: Zirconium/resin cement bond strength is not effected by zirconium coloring procedures.
IMAGES
2635175_File000000.JPG
2635175_File000001.JPG
2635175_File000002.JPG
2635175_File000000.JPG
2635175_File000001.JPG
2635175_File000002.JPG