IADR Abstract Archives
The Effect of Hard Tissue Surgical Changes on Soft Tissue
Objectives: The purpose of this pilot study was to test reliability of a new method to evaluate orthognathic surgery outcomes and, secondarily, to understand the effect of hard tissue changes on soft tissue displacement.
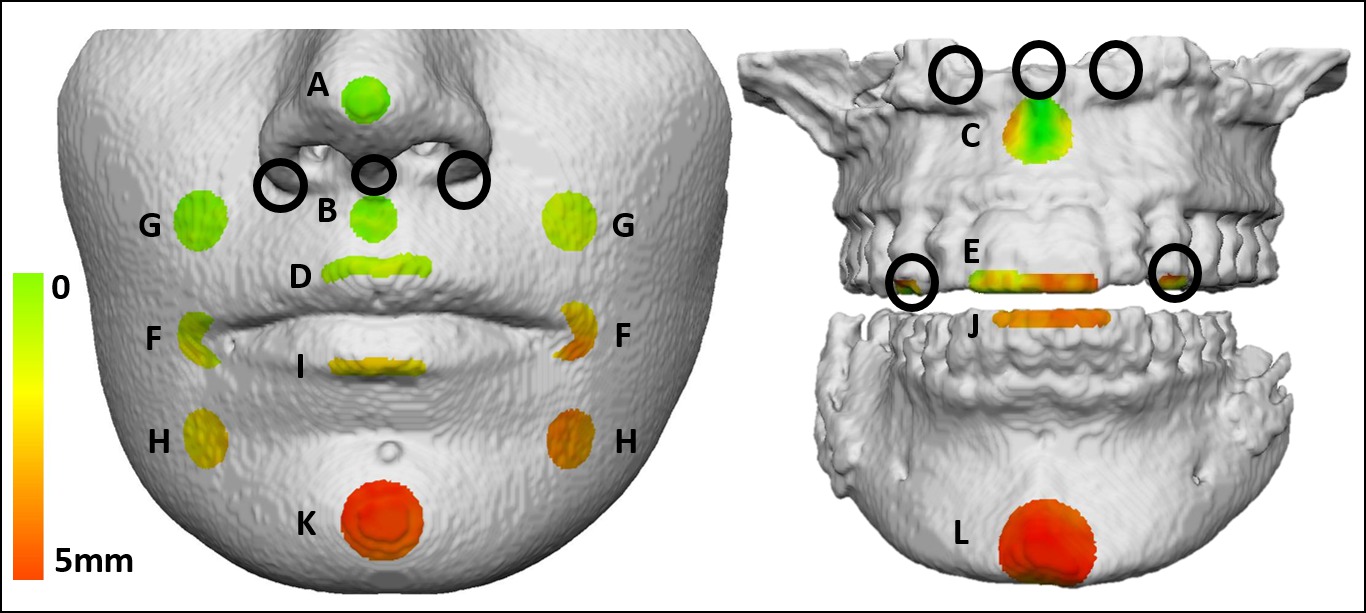
Methods: The sample consisted of eight patients who underwent bimaxillary advancement and had CBCT at two time points (before surgery and 6-8 months follow-up). Voxel-based cranial base superimposition was used to register the scans. Three-dimensional surface models were created and a different technique of iterative closest point, which focused on areas rather than specific landmarks, was used to measure and correlate the changes. Imagine and ITK-Snap (both NIH funded) were used to perform the superimposition and create the surface models, respectively. VAM (Canfield Scientific, Fairfield, NJ) was used to perform the measurements. The average displacements of 15 areas (4 hard tissue and 11 soft tissue, figure 1) were measured twice after a one-month washout period. Intraclass correlation coefficient (ICC) was done to test the measurements’ reproducibility and Spearman rank correlation was used to correlate the hard and soft tissue changes. The correlation was divided between maxillary and mandibular areas. Significance was set at p<0.05.
Results: ICC was >.99 for all measurements. Tables 1 and 2 show the correlation between hard and soft tissue changes for the upper and lower jaw, respectively. Changes of the tip of the nose did not correlate with changes in any maxillary area, whereas soft tissue A point, A point and upper lips had correlation with several areas. The highest correlation for the maxilla was between the upper lip and the left/right supra cheilion (p<.01, r=.91 and p<.01, r=.93, respectively). In the mandible, very few areas were correlated and the majority of them involved soft tissue pogonion, pogonion and lower incisors with the strongest between pogonion and lower incisors (p<.01, r=.98).
Conclusions: The method showed high reproducibility for the measurements. The correlation found in this and future studies with greater sample sizes can help to predict the soft tissue outcomes of orthodontic-surgical therapies and aid professionals in developing goal-oriented treatment plans.
IMAGES
2596099_File000000.jpg
2596099_File000000.jpg